iMovie by Ellie of WELS BRB
I know that many people end up their units with a cool, hands on activity. However, I decided to start my Linear Equations unit with one. This was easily the best activity that I have ever done with my students. And, I believe they learned more from it than any other activity.
I saw this activity on Fawn‘s blog, and have wanted to try it ever since! She has a wonderful write up of all of the steps, and even a worksheet that I used (and it is hilarious) so I recommend you go there next to get more information on this. NCTM illuminations also has this in their resources, and it is good to read as well, but I liked Fawn’s version better! I took both lessons and then put my own spin on it, and am hoping to extend it for our study of equations of lines.
I put my students into groups of three and four and then showed them these two You Tube videos. They both are excellent and serve different purposes. One video illustrates how thrilling it would be to bungee jump from the highest place possible. The other video (on Land Diving) illustrates how we DON’T want to hit our heads and even talks about how important the length of the cord it.
YouTube Videos:
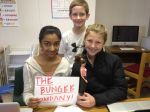
I then told them that they were going to create their own Barbie Bungee Company. I had them brainstorm to come up with a company name and their company goals. Our school is heavily invested in project based learning and I have found that students are much more invested in any project or activity if they come up with the objectives.
Fun names were picked like “Barbie Daredevil” and “Extreme Sky Bungee”. My students had very realistic goals. They all wanted to make more money than their competitors by giving Barbie the MOST thrilling ride, without killing her.


After this was established, I passed out Fawn’s worksheet and they got to work dropping Barbie from 0, 2, 4, and 6 rubber bands. I encouraged them to drop her several times from each and record each drop to get greater accuracy. Some groups listened and some did not. They did not yet realize the importance of accuracy. I would let them drop her from no more than 6 rubber bands to get their line of best fit.
At this point I added from Fawn and NCTM’s lesson in order to more thoroughly analyze their lines of best fit before the big drop. I am go glad I added this part as it ended up being the part of my lesson where the most learning occurred. Our final Barbie Bungee was going to be a drop from 160″. However, I first wanted them to use their line of best fit to do a “test drop” from the ceiling of my classroom, at a height of 94″. We talked about “market research” with businesses, and how important testing from 94″ was before we went to 160″.
I had each group make their prediction of how many rubber bands they would need to safely drop Barbie from the ceiling. This information needed to be kept TOP SECRET so that the other groups would not steal their companies ideas. They really got into this and my usually loud group work classes were full of excited and hushed whispers.
During the test drops, only one groups Barbie had a very thrilling ride (close to the floor without hitting) the first time. Most groups either hit the floor or were not close enough to the floor. I sent those groups back to the “prediction” drawing board. This is where most of their line of best fit learning took place. They knew they either needed to add or take rubber bands away. However, I had them look at this on their graph so they realized their line of best fit was off. Only after they adjusted their line of best fit, would I let them retest. I emphasized that they should not be guessing how many rubber bands to take on or off, but predicting the number by adjusting their line of best fit.
After they readjusted their line of best fit and made a new prediction, I let them test again. Most of the groups were much more successful on their second test drop. I had them measure how far Barbie came to the floor so that they could add this new data point to their graph. At this point, some groups noticed that she fell further than they had predicted, and slightly adjusted their line of best fit again.
Next it was time to make their predictions for the 160″ drop! I had told them that they would be dropping Barbie 160″ but did not give them much instruction when they were creating their original graphs. Therefore, some groups had to redraw their graphs (or add more paper) to extend their graph to 160″. This was an excellent learning experience as well! After they made their predictions, “locked it in” on a sticky note, and added the rubber bands to Barbie, it was time to do the big drop!!
The big drop was very successful and EXCITING. We videoed each drop – and their excitement as well as the things they said were priceless. The You Tube playlist is at the end of this post. Only one group had a major Barbie fatality. Two of the three groups were very, very close and we had to drop her several times to make sure that she hit the ground. One group is still in heated contention. I love it when they argue about the math! Two groups dropped her dangerously close to the ground without hitting. It was a thing of beauty!
After we dropped our Barbies, we went back in to analyze the math. I had them enter their first 5 data points (for the 0, 2, 4, 6 and test drop rubber bands) into an Alcula linear regression website. 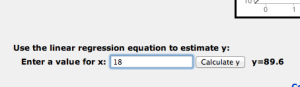 This site was GREAT as it graphed their data, gave them a regression line, and then let them enter rubber bands (x-axis) to see how many inches Barbie would dropped based on their line. This was when the real magic happened. When the closest group entered their rubber bands, the math returned 159.4″. They were thrilled.
The day after the Barbie Bungee was the last day of school before Christmas break. So, I gave them the option of using the videos we took of Barbie Bungee to make iMovies. All of the students jumped at that! Two of them even finished their iMovie in class. Some of my students are very skilled at iMovie! As I get more of their iMovies, I will post them back here. This was completely optional for my students. Some some added more details, and some focused more on Barbie’s exciting drop! I had two groups ask me if they could do a Powerpoint or Prezi instead since they weren’t great at iMovie. I love that they wanted to do any of it! I plan to make my own iMovie – if I can find the time. I am sure it will not be as clever or inventive as my students movies however!
For the next step I am going to use these graphs to explore what each piece of their regression line really means. Hopefully, they will understand what a y-intercept is because of Barbie’s height and realize what the coefficient with x means because of the inches they were trying to reach with added rubber bands.
I had each of them answer reflection questions on a Google Doc. The questions included asking what they could have done to have a better drop and what advice they would give to next year’s students. They had great advice! Here are some of my favorites.
- “For next year’s students, I would tell them to be very careful when graphing and drawing their line of best fit. They should have fun, but be diligent with their work at the same time.”
- “I wish we could have redone our graph more accurately. Make sure to be organized, and keep all supplies and papers together. You also really need to follow directions and stay on task.” (This group had the major Barbie fatality).
- “Do not rush to finish first, take a good amount of time to guess 94” and 160” because the guesses is what Barbie’s fate is based upon.”
- “We could have used that website and then we would be more accurate. Take your time when drawing the line of best fit and measure right.”
- “To be more accurate, we could have done more test drops and used more exact measurements when Barbie was bungeeing. Test your barbie several times and go through all of the math 2 times just to check for any math errors.

I totally want to do this, or something like it. This year will not be the bungee Barbie year for me in math because lines of best fit don’t go with the grade I teach, but someday! Or, I might add it to the forces & motion science unit in the spring as part of the data collection and interpretation requirement.
I have an enrichment class each nine weeks and we did something similar last nine weeks. We will definitely use some of your ideas next time!
Pingback: Barbie Bungee iMovie – Line of Best Fit | I Speak Math
Pingback: Barbie Bungee Follow Up – Be Careful When Using “The Recipe” | I Speak Math
Pingback: Mousetrap Car Montage! | Hilbert's Hotel
Julie-the video link says “video doesn’t exist”. Do you remember the name so I can google it? When I google bungee jump videos, it’s all videos of people who’s cord breaks. Thx!
I checked it today and it worked for me. Just in case I put the names of the videos as well as individual links in the post. If you can’t click on the links then just google the exact names and they will come up.
Pingback: 7th Grade – Problem Solving Goal 2013-2014 | I Speak Math
Pingback: Bungee Barbie | Learning Math is Messy
Pingback: Are you Brave Enough to Bungee? Lesson Study Part 2 | Common Core Cohort
Pingback: Barbie Bungee 2014 | I Speak Math
Pingback: A1 Mini Projects | Crazy in Math
Pingback: Student Friendly Desmos | Crazy in Math
My first thought to solve the debate of whether Barbie has a concussion is to place a piece of thin tin on the ground. If she hits, they should be able to hear it.
Do you know the links for Fawn’s website? I couldn’t get the link to work.
Pingback: Barbie Bungee: Illuminations – atlasimport.stpaulmedia.net